~ 8 min read
How to dive deep into GitLab Metrics with SQLite and Grafana

A recent optimization has left us again excited - the pipeline speed for a new project had significantly improved. Execution times had basically cut in half across the board. Looking at a few jobs, we could confirm this on an individual basis, but we were wondering about the bigger picture. How had the pipeline improved over a bigger timespan?
GitLabs DashboardsSection titled GitLabs Dashboards
Having asked this question, the natural start were the existing GitLab dashboards. GitLab has a wide variety of different dashboards already built-in, so it seemed likely that we would find the answer there.
GitLab’s CI/CD AnalyticsSection titled GitLab’s CI/CD Analytics
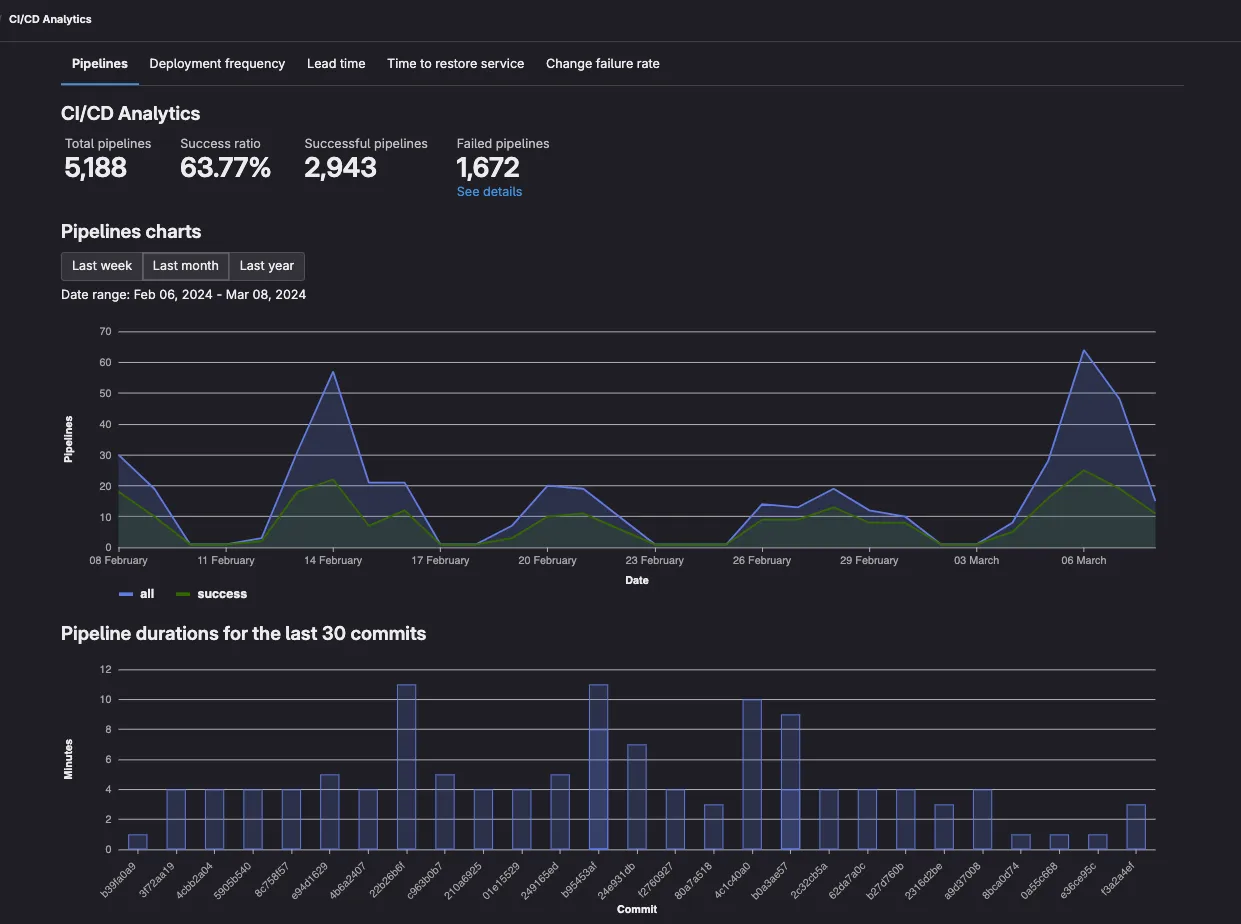
Under the projects Analyze tab, there is the CI/CD Analytics dashboard. A basic view of the number of successful and total pipeline runs. Below are the pipelines for the most recent commit. Pipelines which fail early appear as shorter, which makes it not very useful for our analysis.
Other dashboards in the Analyze tab sound intriguing, but they mostly display graphs based on the amount of commits, merge requests, GitLab issues or lines changed.
GitLab’s Build TabSection titled GitLab’s Build Tab
The Build tab allows a review of the most recent jobs and pipelines, but it lacks insights into a broader performance picture. The results are simply returned as a paginated table. For pipelines this can give an impression on an individual basis, but grasping the overall trend over a longer period is hard.
Especially with the Jobs search getting a job overview is challenging. This search is infamous for only allowing to filter by job status, not by name. The related issue #22027 for the underlying api is 5 years old, with many people wishing for its resolution.
GrafanaSection titled Grafana
Leaving empty-handed from the GitLab search, we turned our focus towards Grafana.
Grafana GitLab PluginSection titled Grafana GitLab Plugin
The Grafana GitLab datasource seems like a very powerful plugin. It comes free for Grafana Cloud subscriptions, which also has a free tier, or for any Grafana Enterprise license.
Unfortunately in our scenario, we cannot simply pipe our corporate GitLab data into a Grafana Cloud account for some ad-hoc analysis, and our company doesn’t have the enterprise license. Though it only supports the pipelines and not jobs, if your company fills these requirements, it might be a good option for you.
Grafana GitLab IntegrationSection titled Grafana GitLab Integration
The Grafana GitLab integration concerns itself with the monitoring of GitLab runners. It shows the number of executed jobs, together with a number of HTTP status codes returned by the runners.
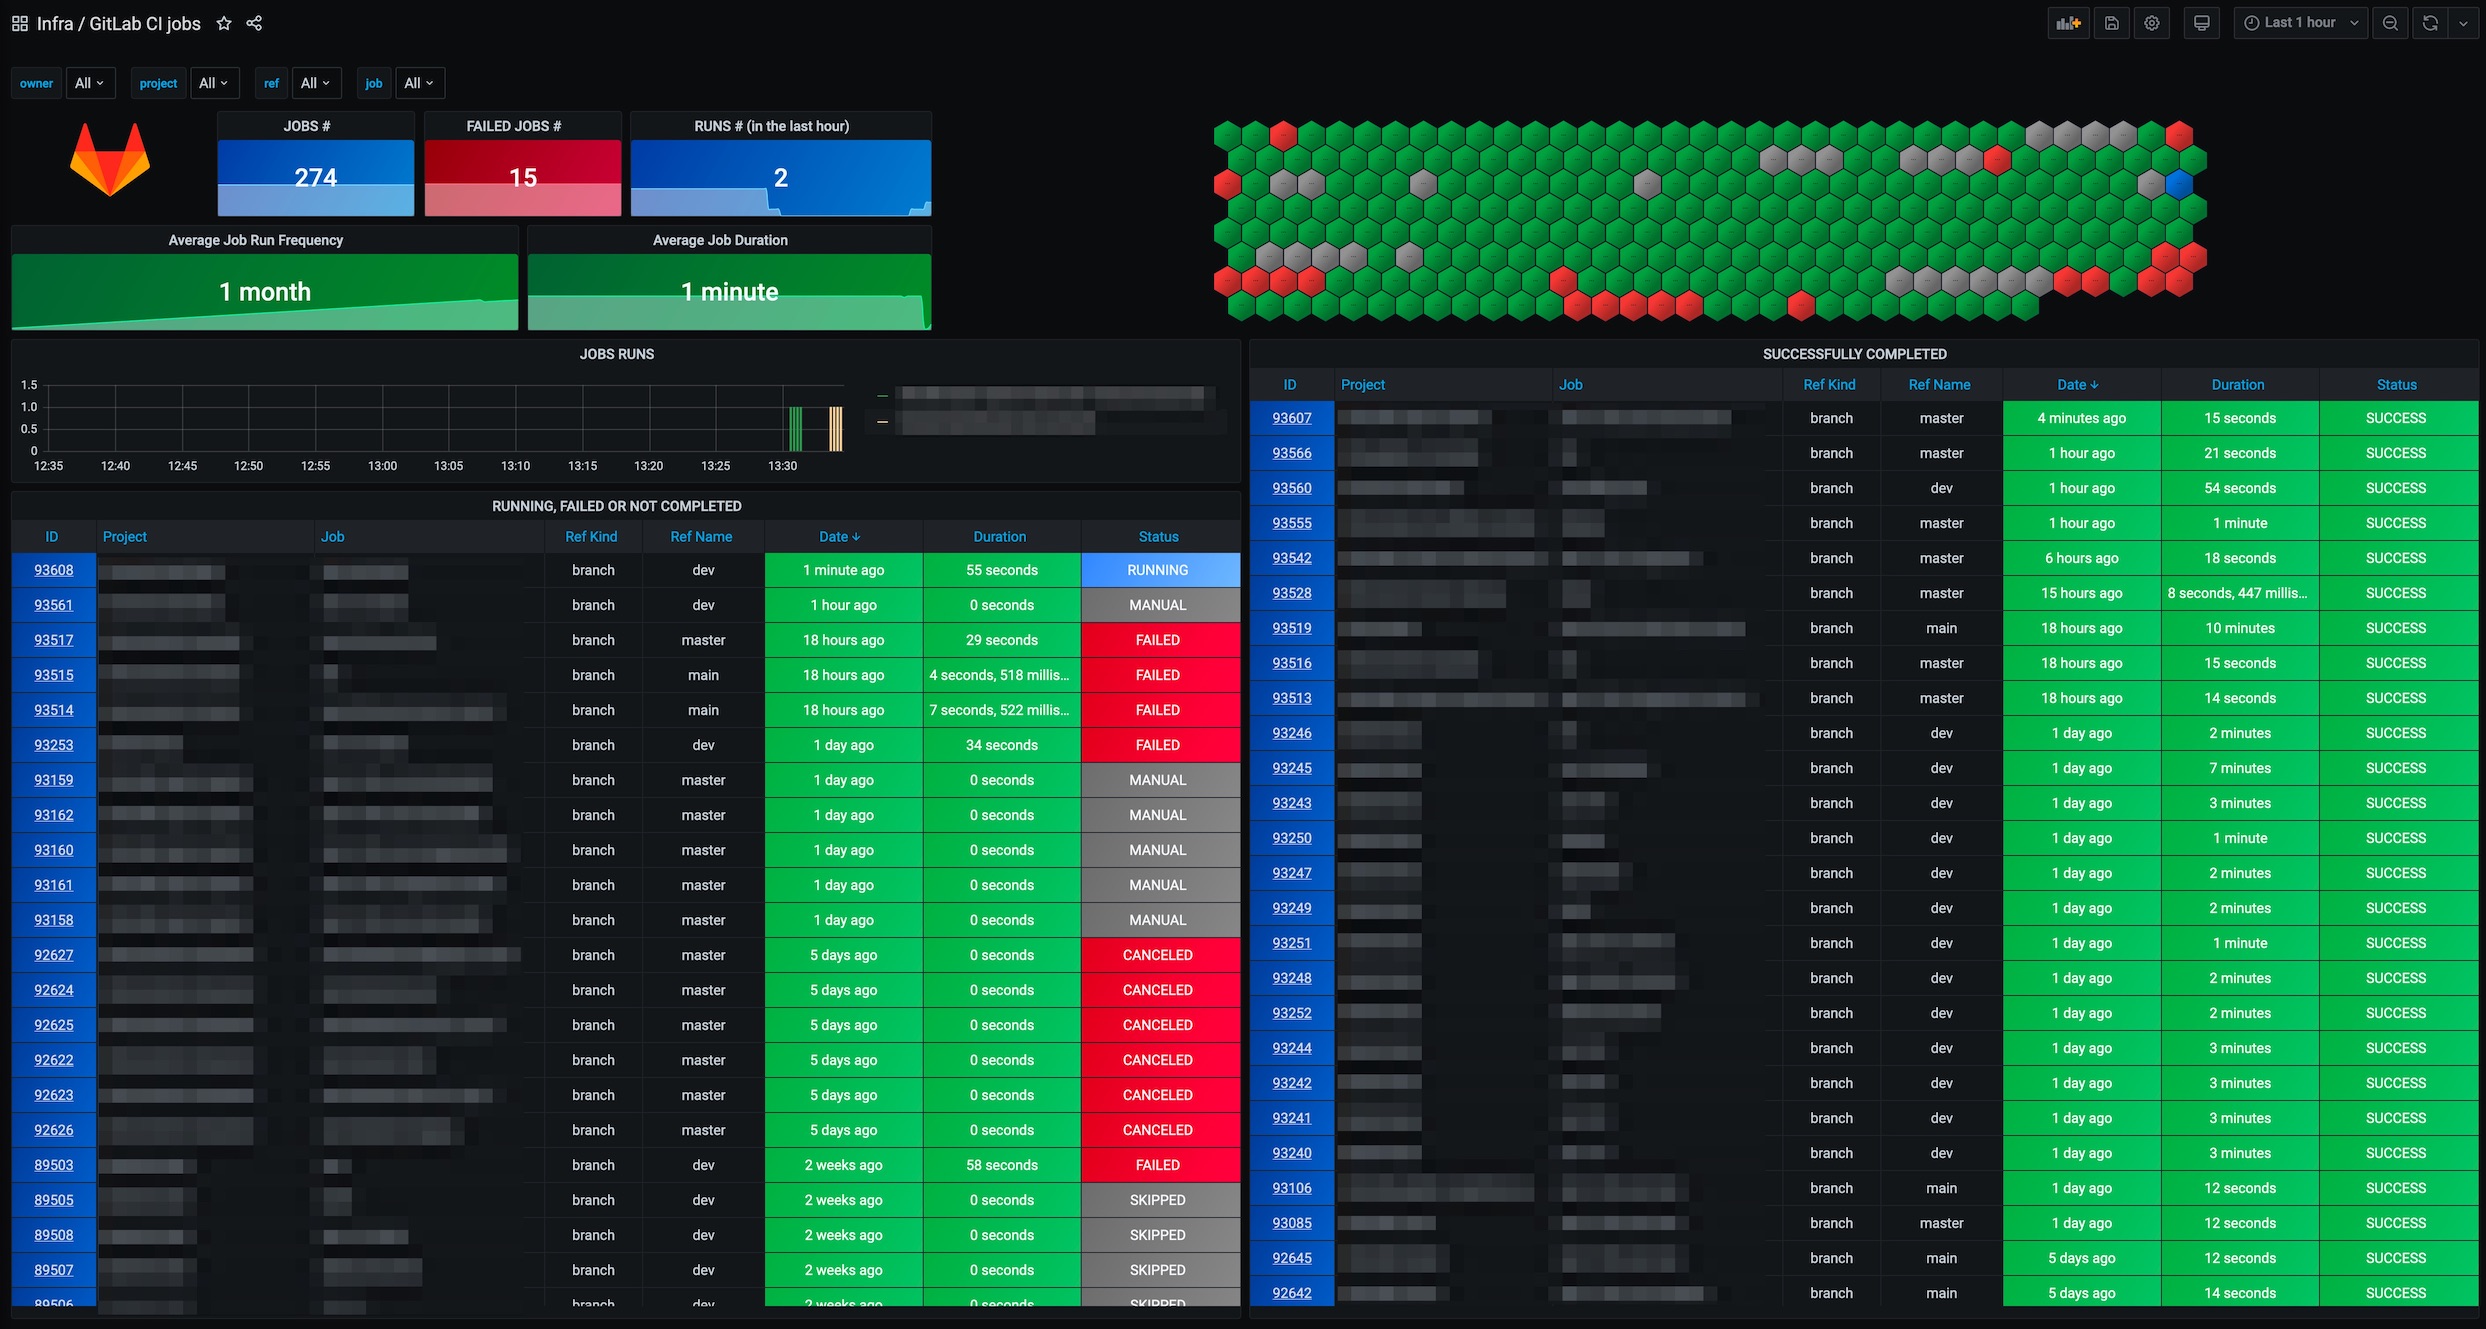
The related gitlab-ci-pipelines-exporter in the screenshot above operates at the same level of the GitLab runner, but publishes many more metrics, including the much desired job information. If you have your runners self-hosted on kubernetes, together with a prometheus backend then this is probably the best option.
Grafana and SQLiteSection titled Grafana and SQLite
With the easy options off the table there were few choices left. We had to build something ourselves, fetching the data via the GitLab api and ingesting them into some datasource.
The company that we work at does not have a Grafana server and the only monitoring tool is basically cloudwatch, to ingest this data we will have to start Grafana locally.
The complete code is also available here.
1) Exploring the dataSection titled 1) Exploring the data
Gladly GitLab offers a supergraph, which can be easily explored with their public graphql explorer. After a few tries, we had our paginated query:
query jobs($after: String) {
  project(fullPath: "path/to/repo") {
    jobs(statuses: [SUCCESS, FAILED], after: $after, first: 100) {
      pageInfo {
        startCursor
        endCursor
      }
      nodes {
        id
        name
        status
        startedAt
        finishedAt
        duration
        queuedDuration
        pipeline {
          id
          status
          computeMinutes
          duration
          complete
        }
      }
    }
  }
}
2) Fetching the dataSection titled 2) Fetching the data
Creating a small script is especially easy with bun. Bun’s great usability together with great docs and file api makes it a great fit for any smaller task.
mkdir fetchdata
cd fetchdata
bun init
In getting the data, we can retrieve as many pages as we like. The maximum page size is 100, so we will need to call this function a couple of times until we hit our threshold.
import SQLite from 'bun:sqlite';
import file from 'bun';

// Environment variables for configuration
const REPO_PATH = 'path/to/repo';
const GITLAB_TOKEN = Bun.env.GITLAB_TOKEN;
const PAGE_SIZE = 100;
const JOB_LIMIT = 20000;
const DB_PATH = 'jobs_database.sqlite';
const GRAPHQL_ENDPOINT = 'https://gitlab.com/api/graphql';

async function fetchJobs(after?: string): Promise<{ jobs: JobData[]; nextCursor?: string }> {
  const query = `your GraphQL query here, including variables for pagination`;
  const variables = after ? { after, first: PAGE_SIZE } : { first: PAGE_SIZE };

  const response = await fetch(GRAPHQL_ENDPOINT, {
    method: 'POST',
    headers: {
      'Content-Type': 'application/json',
      'Authorization': `Bearer ${GITLAB_TOKEN}`,
    },
    body: JSON.stringify({
      query,
      variables,
    }),
  });

  const { data } = await response.json() as any;
  const jobs: JobData[] = data.project.jobs.nodes;
  const nextCursor = data.project.jobs.pageInfo.endCursor;

  return { jobs, nextCursor };
}
3) Transforming the dataSection titled 3) Transforming the data
After downloading the data, we can dump it into a SQLite database for local analysis. But first, we will need the insert statements. With ChatGPT we can easily generate the related type and create table statement, just based on the graphql query.
interface JobData {
  id: string;
  name: string;
  status: string;
  startedAt: string;
  finishedAt: string;
  duration: number;
  queuedDuration: number;
  pipeline: {
    id: string;
    status: string;
    computeMinutes: number;
    duration: number;
    complete: boolean;
  };
}

// SQLite Database initialization
const db = new SQLite(DB_PATH);
db.query(`
  CREATE TABLE IF NOT EXISTS jobs (
    id TEXT PRIMARY KEY,
    name TEXT,
    status TEXT,
    startedAt TEXT,
    finishedAt TEXT,
    duration INTEGER,
    queuedDuration REAL,
    pipelineId TEXT,
    pipelineStatus TEXT,
    pipelineComputeMinutes REAL,
    pipelineDuration INTEGER,
    pipelineComplete INTEGER
  );
`).run();


function insertJobs(jobs: JobData[]) {
  jobs.forEach(job => {
    const query = db.query(`
      INSERT INTO jobs (id, name, status, startedAt, finishedAt, duration, queuedDuration, pipelineId, pipelineStatus, pipelineComputeMinutes, pipelineDuration, pipelineComplete)
      VALUES (?1, ?2, ?3, ?4, ?5, ?6, ?7, ?8, ?9, ?10, ?11, ?12)
`);
    query.run(
      job.id,
      job.name,
      job.status,
      job.startedAt,
      job.finishedAt,
      job.duration,
      job.queuedDuration,
      job.pipeline.id,
      job.pipeline.status,
      job.pipeline.computeMinutes,
      job.pipeline.duration,
      job.pipeline.complete ? 1 : 0,
    )
  });
}

async function runIngestionProcess() {
  let endCursor: string | undefined = undefined;
  let jobsCounter = 0;
  do {
    const { jobs, nextCursor } = await fetchJobs(endCursor);
    insertJobs(jobs);
    jobsCounter += PAGE_SIZE;
    console.log(`Retrieved ${jobsCounter} jobs`)
    endCursor = nextCursor;
  } while (endCursor && jobsCounter < JOB_LIMIT);
  db.close();
}

runIngestionProcess()
4) Ingesting the dataSection titled 4) Ingesting the data
Merging steps 2 and 3, the script it complete and we can trigger it with a bun run. The complete code sample can also be found here: gist.
bun run index.tsFor our 20000 jobs, which is the amount of jobs triggered by a 4 man team over 5 months in one repository, the resulting SQLite file is 5MB. The bottleneck here is more with the fetching of the job data from the api. This can take a few moments, which makes for a great opportunity to grab a hot beverage.
5) Preparing GrafanaSection titled 5) Preparing Grafana
Next up is starting a local Grafana instance.
mkdir data

docker run -d -p 3000:3000 --name=grafana \
  --user "$(id -u)" \
  --volume "$PWD/data:/var/lib/grafana" \
  -e "GF_INSTALL_PLUGINS=frser-sqlite-datasource" \
  grafana/grafana-enterprise
Of course we will also need our SQLite data:
cp jobs_database.sqlite data/Now we can log into our fresh local Grafana instance at http://localhost:3000. Here we need to add this data as a new data source.
Once we initiated this process in the data source section, we can enter the path to the SQLite database:
/var/lib/grafana/jobs_database.sqlite6) Exploring the dataSection titled 6) Exploring the data
Finally we can play around with the data. In Grafana the data is basically modeled via the query, so it can then be displayed in various forms.
For example to display a table of the most recent jobs, the query looks like this:
SELECT * from jobs order by startedAt limit 10;The dashboard that we used for our findings below can also be imported from the gist here.
Our FindingsSection titled Our Findings
On a job level, we could confirm our observed time-savings with real data, over all failed and successful jobs.
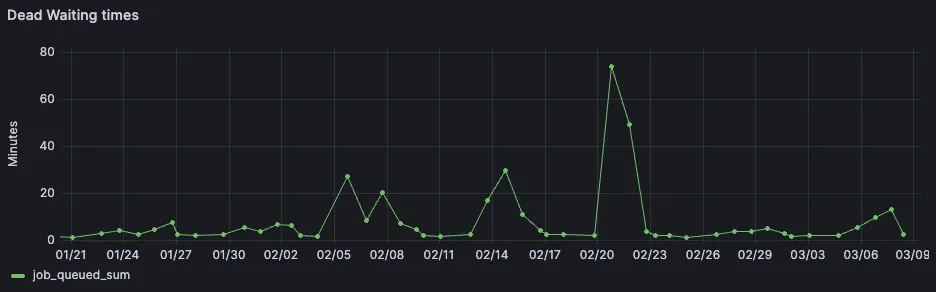
We could also finally see the total amount of job queue times. It is the amount of time a GitLab CI/CD job has to wait, before it gets picked up by a runner.
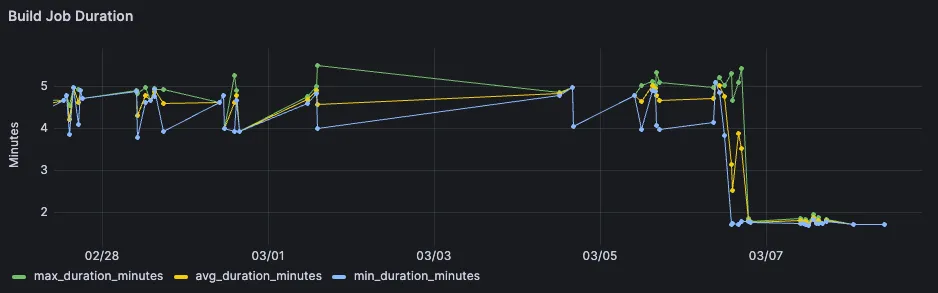
But what was even more interesting that that, was to see the job duration over a larger period of multiple months. While the short-term analysis had confirmed our own observation that the build job got much faster, much more was revealed looking at the same job over a longer timespan.
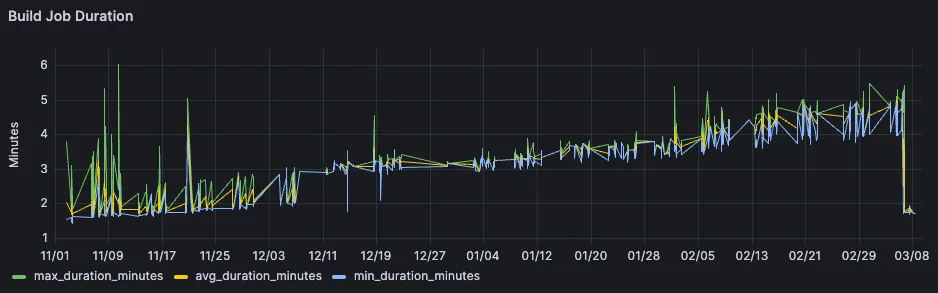
A visible bump around the start of December, together with a general slight upwards trend as the project is getting bigger.
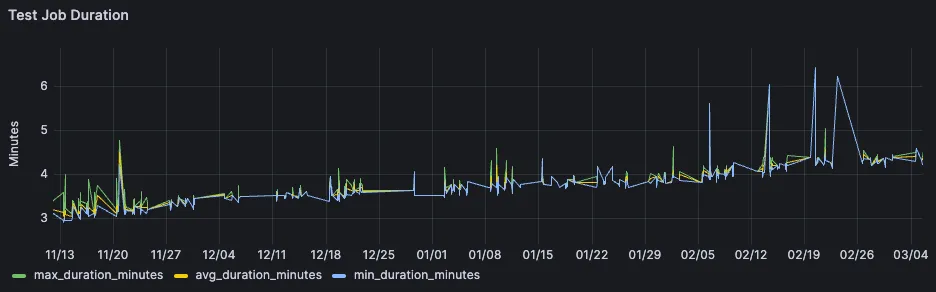
Looking at the test job, we could see a similar upwards trend over time, though the curve is not as steep.
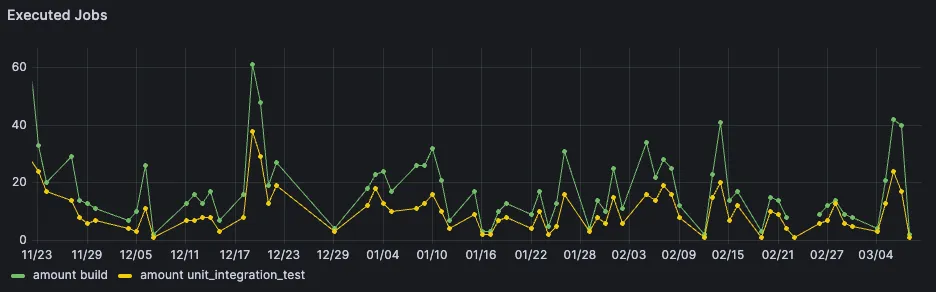
A couple of saved minutes on a single job wouldn’t seem like a huge win, but for the team it felt huge. This is related to other job dependencies which got also optimized, but also due to the amount of times a single job gets triggered every day.
This is also something we can easily query:
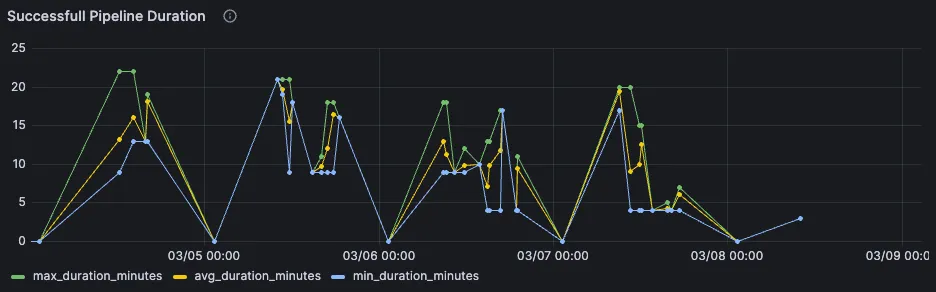
Looking at the overall pipeline speed is more tricky. This is because pipeline looks different based on the branch, but also based on the amount of manual jobs which get triggered. Despite that, we could still see the observed savings in the displayed graph on the very right.
Rounding UpSection titled Rounding Up
Playing around with job data in Grafana was extremely fun. Browsing around the ingested cicd data with a tool as snappy and optimized as Grafana made for a great experience.
The same technique of data analysis can be basically applied to any small dataset, which has timestamps in it. Having such a technique in mind can break through such barriers of lackluster default dashboards, while the data is available via api.
All in all it would be best to have a proper data platform where everything is already prepared to do such analysis easily, either with Grafana, Datadog, or something similar. When these preparations have not been made by your company, we hope the above approach can help you out in this situation.
Any Comments? Join the Discussion on Twitter:
Join us a recent deep dive into gitlab metrics with grafana and sqlite 🎉https://t.co/02mAd4cvQw
— Double Trouble (@doubletrblblogs) March 13, 2024